Where has all the data gone?
Having worked in the construction industry for a number of years, the one thing we know well is how to build and repeat. In fact, it’s something we don’t talk a lot about, as we constantly battle new engineering challenges, reaching new heights of excellence (quite literally), and wanting to outperform every station, hospital, school, housing estate, or other building that’s ever come before us.
We must be able to learn from our mistakes each time and constantly improve, I hear you ask? Well, kind of. It turns out most of this ‘learning’ is held captive in the minds of every talented engineer, planner, construction manager (and the list goes on…), and although there are enormous efforts going on to share best practice in the form of publications, talks, and internal workshops, there is very little data which is actively used to ensure we improve performance with each new build.
When we focus the lens on environmental data; we collect, inform and act on data associated with noise, dust, water quality and waste to name a few, across construction projects up and down the country. However how accessible is this information? Surely we could use this to improve levels on the next project? How about using this to make better predictions for our likely impact? I am sorry to say this just doesn’t happen.
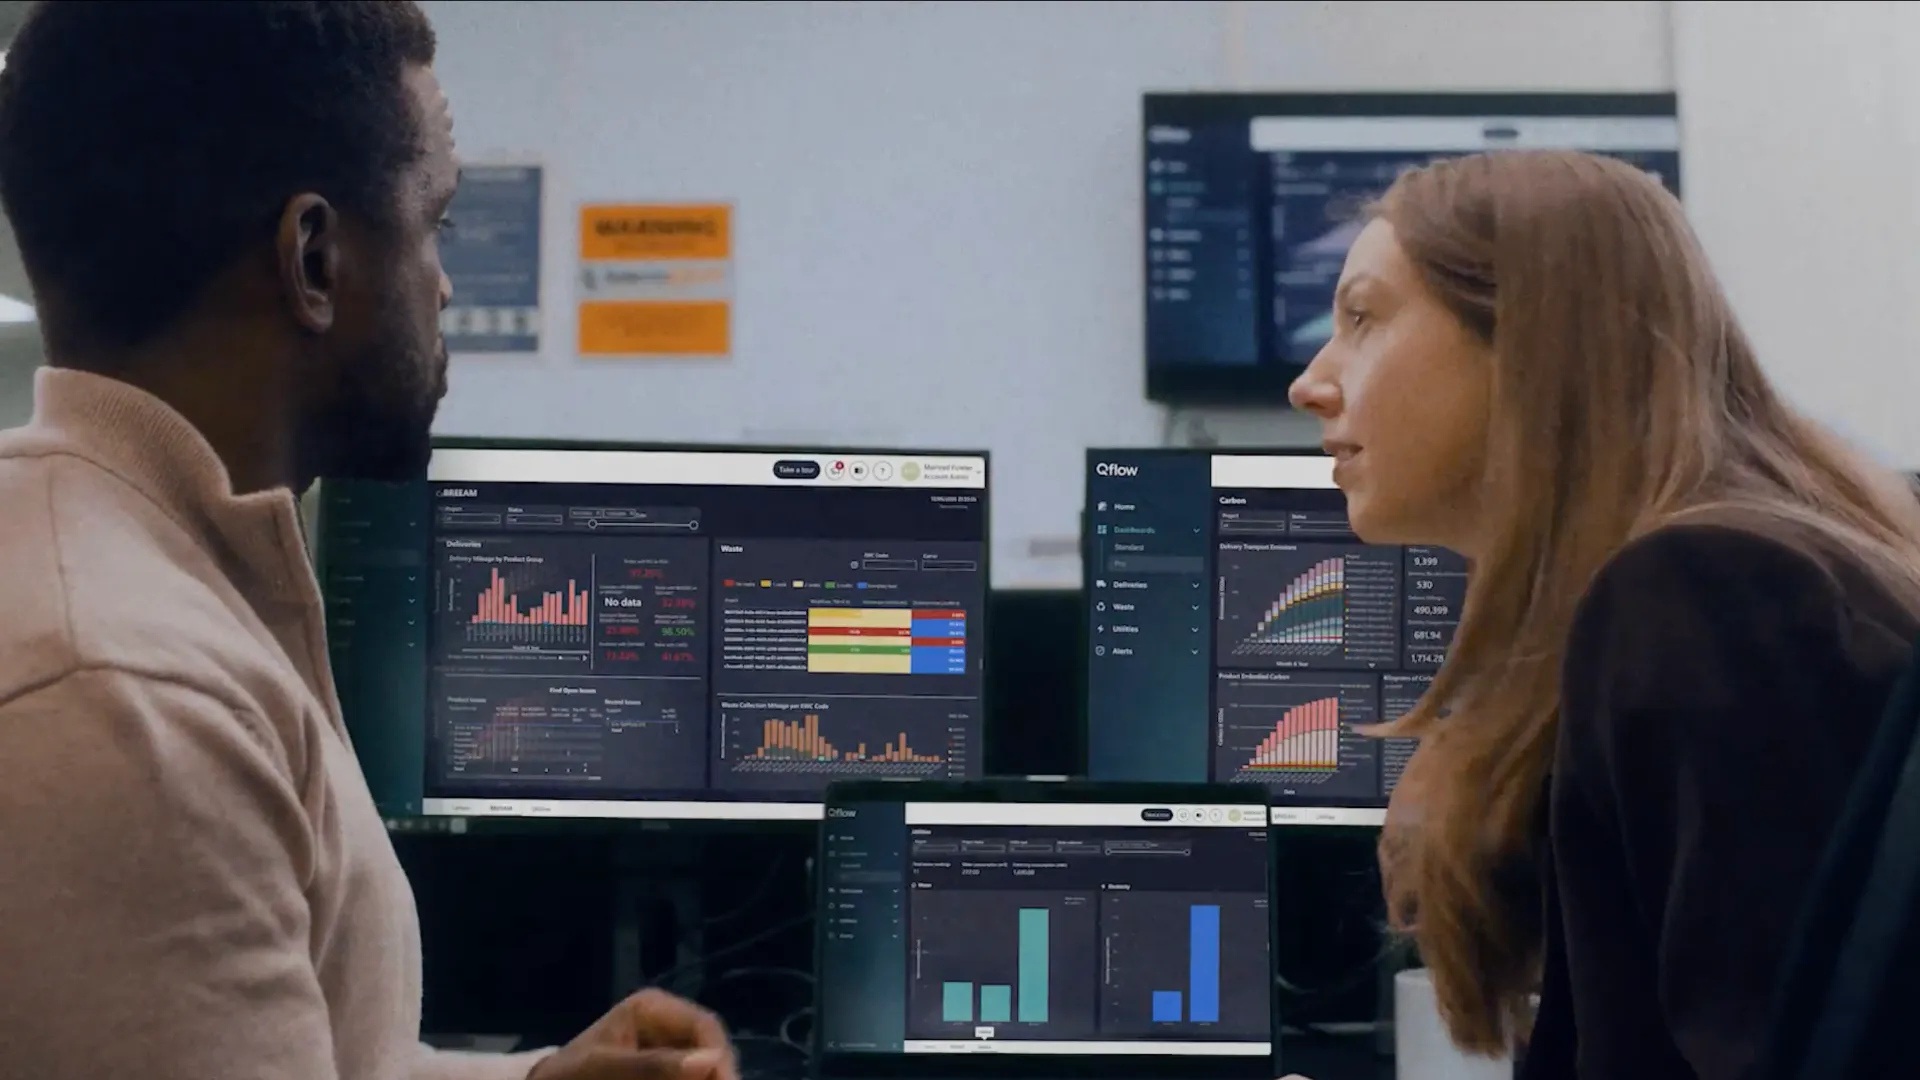
When we first started Qflow we had a wonderful plan to capitalize on the range of environmental data available within the industry, generate new insights on items such as water contamination risks across different catchments, or likely air quality changes associated with public realm designs. Having spent our careers to date working in construction, we had experienced the efforts that were undertaken to collect and report on different environmental requirements. However, what we’d forgotten was that none of this data was effectively stored, cleaned, and available for re-use in any meaningful format. What we had was lots of information, but little actual data.
Aside from the tragedy that this ‘learning’ from past projects couldn’t be effectively used to inform new designs or even regulation, it meant that we had to change our strategy in working towards transforming the way we build our cities, for the benefit of people and the environment.
We have now established a path to standardize environmental data, from the way it’s collected, processed, stored and acted upon to constantly improve construction performance. Once we have created this consistency, we’ll be in a better position to understand actual trends across the industry. No more “oh, this is unexpected…”, “we couldn’t have anticipated this compounding effect…”, or “well, next time we’ll do it better”. We’ll be shifting the dial towards proactive management, and we’ll do this in a way which is founded on solid data, not just information.

Ready to see Qflow in action?
A 20-minute call to walk through the product on the parts that matter to your team.
News & Insights
Resources to build site better data.
Read insights, reports and practical guides on construction waste, carbon, materials, compliance and the changing role of data in the built environment.