Explore how data is used by site teams in the construction Industry
Bob Salmon is a Senior Software Engineer. He has worked in several industries – telecoms, utilities, education charities, HR and construction – and with many kinds of code and data.
Many construction companies probably already have a lot of data. The problem is, there’s a barrier that stops this data from being useful. It might be that the data’s buried, in the wrong place, or in the wrong format, arrives too late or needs to be combined with other data before its value is clear.
It’s like a construction company owning a quarry in another country, knowing that somewhere underground there’s some iron ore, clay or limestone (the data). This is potentially useful, but what’s actually useful is steel and cement (the information derived from the data) that meets specification arriving at the correct site at the right time. Simply getting another quarry, or more freshly-quarried iron ore, probably doesn’t help because construction companies aren’t in the business of collecting rocks – they create homes, hospitals, bridges and so on, and want raw materials to support this in the most cost-effective way.
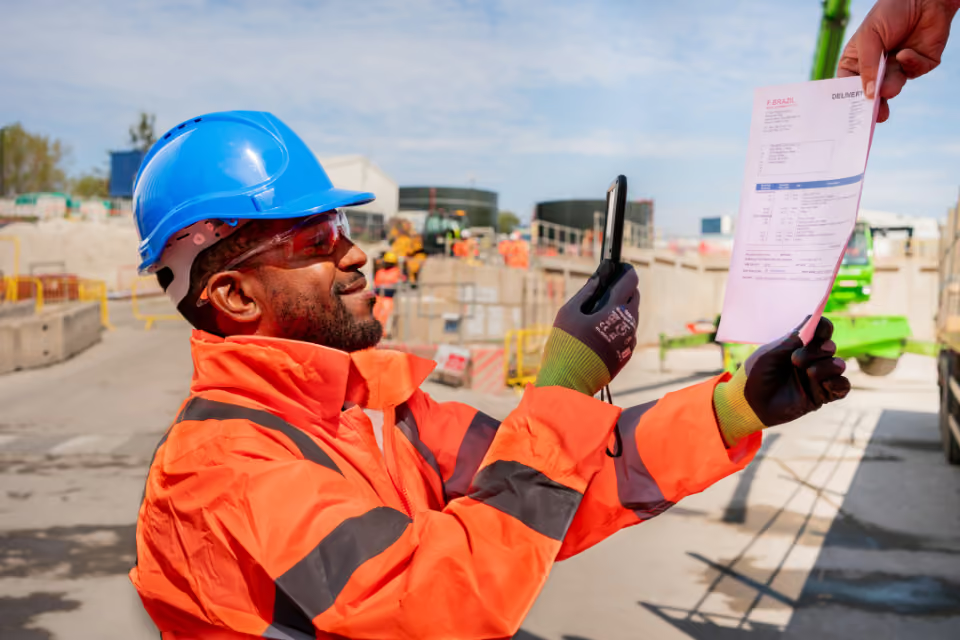
In an analogous manner to the supply of physical materials, Qflow excavates information by digitising existing paper documents (data), which makes the information they contain much easier to work with. We then extract the most useful parts of this information, make sure it’s as neat and tidy as possible, and combine it with other information from sources such as the Environment Agency (the information derived from the data). Fortunately, unlike in the production of e.g. steel or cement, this usually doesn’t involve explosives or large amounts of extremely hot molten metal.
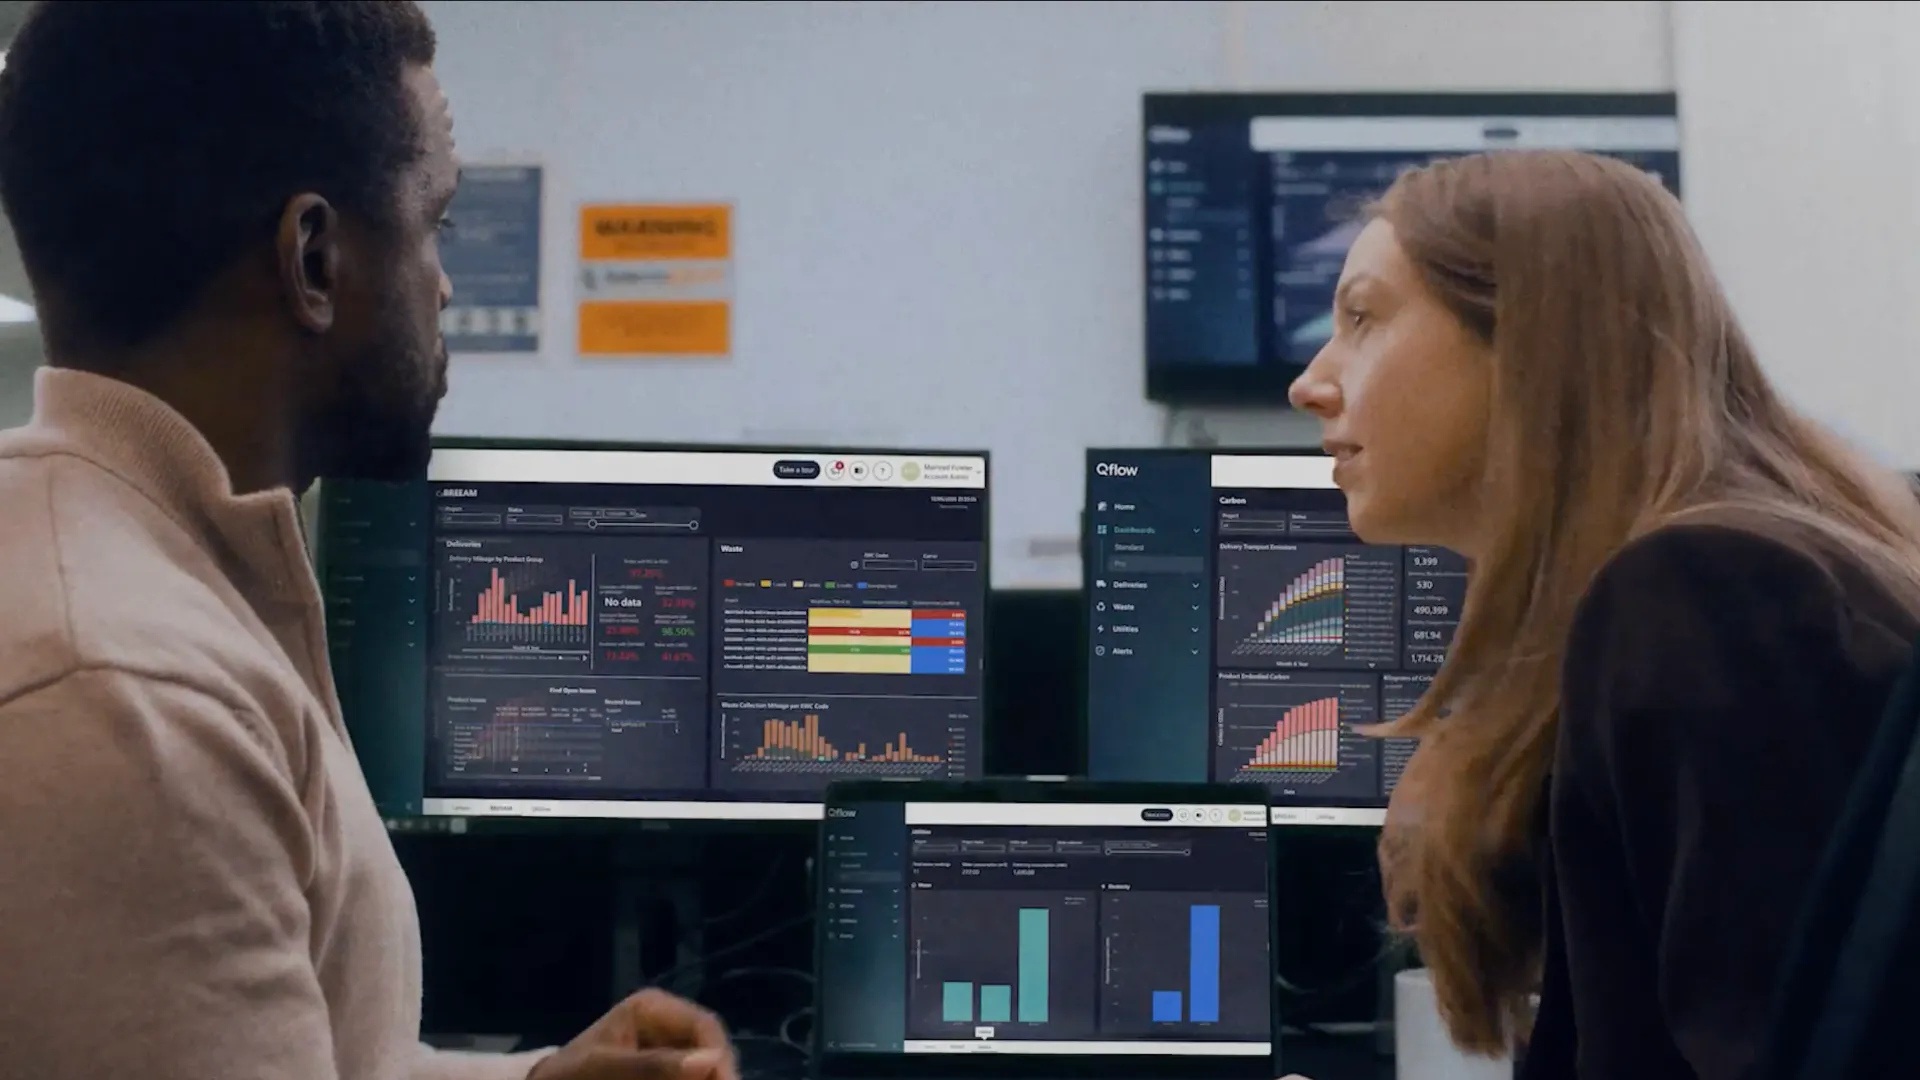
We deliver the information in a form and at a time that is as useful to our customers as we can make it. This is via our web portal, email alerts when we notice something that doesn’t meet rules our customers have told us are important to them, or dashboards that show trends and outliers in the data. We also export the data via an API so that it can be combined with other data that’s in our customers’ world but not ours, such as invoicing data.
Read on to part two to continue exploring how this data is used by site team today.
———————————————————————————————————————————————
Want to find out how you can capture better data and turn it into valuable information?
———————————————————————————————————————————————
However, data isn’t the end of the story, just as steel and cement arriving on-site aren’t. Our customers don’t wake up in the morning and think.

Instead, they think about questions like:
- Are any of my suppliers putting the project delivery budget and date at risk, because they often supply the wrong stuff and this causes delay and rework?
- Is there any way we can deliver the project on time and on budget but with less harm to the environment, such as CO2e?
But how do we answer these questions with data and charts?
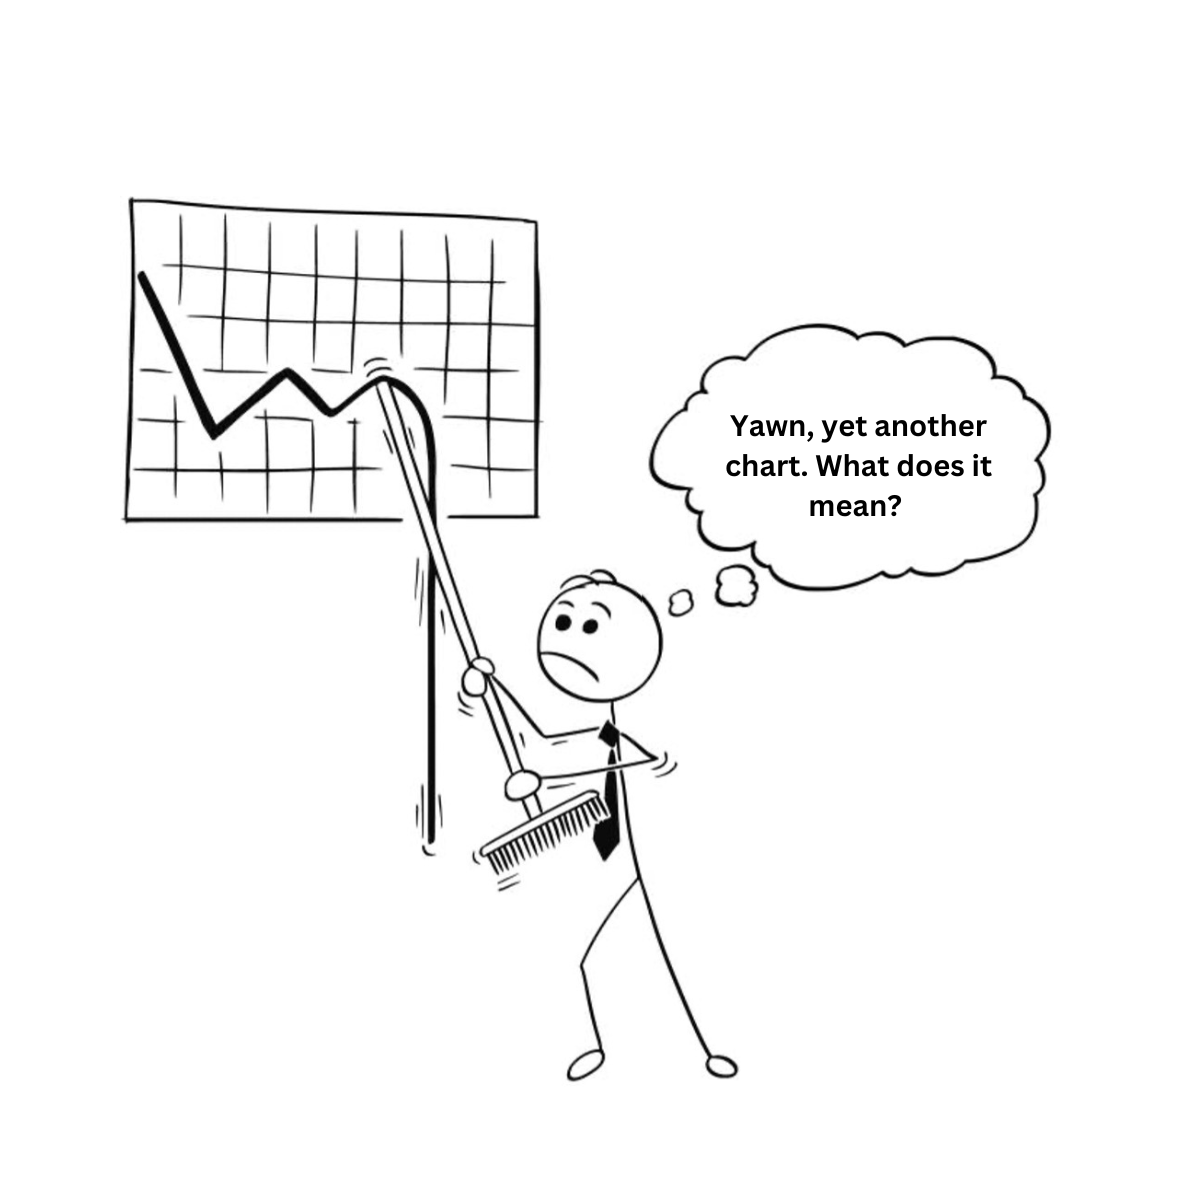
The important thing is that we start with these questions and consider the things that matter to our customers. Then we explore the data we have and what might be missing for us to begin to answer these questions. We seek other data sets to fill those gaps (such as map data to calculate distances travelled for carbon emissions). And only then do we explore the most relevant and accessible visualisations that make people think:

Rather than just:
This relates to something personal for me. One of the things that attracted me to Qflow was that the founders come from the world of our customers. They don’t have to try hard to imagine our customers’ concerns because they have had the same concerns themselves. It’s not a case of technologists with a solution in search of a problem, or people who think they can swoop in and solve whatever issues their customers have based on just cleverness and optimism. Instead of data and technology being in charge, we put the user at the heart of things, and leave data and technology in its proper place: helping people.

Ready to see Qflow in action?
A 20-minute call to walk through the product on the parts that matter to your team.
News & Insights
Resources to build site better data.
Read insights, reports and practical guides on construction waste, carbon, materials, compliance and the changing role of data in the built environment.